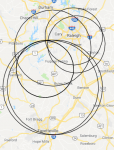
I wanted to create a map with overlapping circles showing the coverage of selected sites in the database, such as on page 17 of the SDS100 manual, or here:
 www.homepatrol.com
Here is the website I used:
 www.mapdevelopers.com
My method was as follows:
First prepare a text file with line entries of the lat/long and distance. If a mistake is made, the subsequent work will be less tedious. An example entry from mine (which I list in alpha order so I can glance at my scanner and ensure I've got everything):
NCSHP Training Center
35.7112642 -78.6141709 15 m

Go to above website. Click "Only Show Border." Then:
1. Paste Lat/Long into Address field
2. Enter Radius
3. Click "New Circle"
Repeat these 3 steps until all your entries are completed.
When finished, be sure to copy and save the link it creates below the map, so you can quickly recreate it later.
I then did a simple screenshot and sent it to my printer. Maybe this will help someone. If there's an easier way (such as simply clicking all the Sites in RR and have it generate it!) please let me know.

Regards,
Mark L in Apex NC
How it Works: Location, Location, Location
Uniden's HomePatrol-1 is the first digital TrunkTracker IV Communications Receiver that requires no user programming. Simply turn it on, enter your location, and you will immediately begin hearing communications in your area. This functionality is made possible by combining the rich radio system...
Here is the website I used:
Draw a circle with a radius on a map
My method was as follows:
First prepare a text file with line entries of the lat/long and distance. If a mistake is made, the subsequent work will be less tedious. An example entry from mine (which I list in alpha order so I can glance at my scanner and ensure I've got everything):
NCSHP Training Center
35.7112642 -78.6141709 15 m
North Carolina VIPER Site: NCSHP Training Center
North Carolina VIPER Site: NCSHP Training Center Details
www.radioreference.com
Go to above website. Click "Only Show Border." Then:
1. Paste Lat/Long into Address field
2. Enter Radius
3. Click "New Circle"
Repeat these 3 steps until all your entries are completed.
When finished, be sure to copy and save the link it creates below the map, so you can quickly recreate it later.
I then did a simple screenshot and sent it to my printer. Maybe this will help someone. If there's an easier way (such as simply clicking all the Sites in RR and have it generate it!) please let me know.

Regards,
Mark L in Apex NC
Last edited:


