Greetings,
I’ve been using the same install/setup for the last two years and haven’t had a singe issue out of the install — now I’m getting this after about 3 or 4 hours of running and I can’t figure out what in the world changed other than updating to a newer release a few days ago.
Using this for my startup (it’s also running as a service);
./rx.py --nocrypt --args "rtl=0" --gains 'lna:36' -S 57600 -q 0 -d 0 -v 1 -2 -T lake_trunk.tsv -V -w -M my_meta.json -l http:192.168.0.15:12345
tsv file;
"Sysname" "Control Channel List" "Offset" "NAC" "Modulation" "TGID Tags File" "Whitelist" "Blacklist" "Center Frequency"
"Lake County" 855.8625 0 0 "c4fm" "lake.tsv" "white.tsv"
(this is of course properly tab delimited in the actual file, but RR just mangled it)
May 20 23:42:11 raspberrypi bash[23988]: 05/20/22 23:42:11.168480 control channel timeout
May 20 23:42:12 raspberrypi bash[23988]: 05/20/22 23:42:12.192170 control channel timeout
May 20 23:42:13 raspberrypi bash[23988]: 05/20/22 23:42:13.216538 control channel timeout
May 20 23:42:14 raspberrypi bash[23988]: 05/20/22 23:42:14.238941 control channel timeout
May 20 23:42:15 raspberrypi bash[23988]: 05/20/22 23:42:15.263471 control channel timeout
May 20 23:42:16 raspberrypi bash[23988]: 05/20/22 23:42:16.287285 control channel timeout
May 20 23:42:17 raspberrypi bash[23988]: 05/20/22 23:42:17.439046 control channel timeout
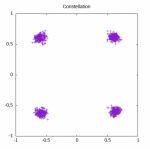
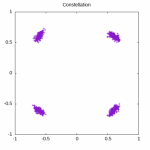
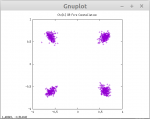
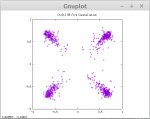
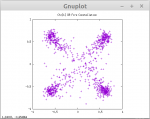
I assumed the dongle all of a sudden started to drift, but the plots all look great until this happens then this just randomly happens. If I restart the service it’s just fine again for a few hours and then it just drops the control channel again. Only thing I can think of is something changed with the antenna. I changed the dongle to a brand new one, same issue.
I’ve been using the same install/setup for the last two years and haven’t had a singe issue out of the install — now I’m getting this after about 3 or 4 hours of running and I can’t figure out what in the world changed other than updating to a newer release a few days ago.
Using this for my startup (it’s also running as a service);
./rx.py --nocrypt --args "rtl=0" --gains 'lna:36' -S 57600 -q 0 -d 0 -v 1 -2 -T lake_trunk.tsv -V -w -M my_meta.json -l http:192.168.0.15:12345
tsv file;
"Sysname" "Control Channel List" "Offset" "NAC" "Modulation" "TGID Tags File" "Whitelist" "Blacklist" "Center Frequency"
"Lake County" 855.8625 0 0 "c4fm" "lake.tsv" "white.tsv"
(this is of course properly tab delimited in the actual file, but RR just mangled it)
May 20 23:42:11 raspberrypi bash[23988]: 05/20/22 23:42:11.168480 control channel timeout
May 20 23:42:12 raspberrypi bash[23988]: 05/20/22 23:42:12.192170 control channel timeout
May 20 23:42:13 raspberrypi bash[23988]: 05/20/22 23:42:13.216538 control channel timeout
May 20 23:42:14 raspberrypi bash[23988]: 05/20/22 23:42:14.238941 control channel timeout
May 20 23:42:15 raspberrypi bash[23988]: 05/20/22 23:42:15.263471 control channel timeout
May 20 23:42:16 raspberrypi bash[23988]: 05/20/22 23:42:16.287285 control channel timeout
May 20 23:42:17 raspberrypi bash[23988]: 05/20/22 23:42:17.439046 control channel timeout
I assumed the dongle all of a sudden started to drift, but the plots all look great until this happens then this just randomly happens. If I restart the service it’s just fine again for a few hours and then it just drops the control channel again. Only thing I can think of is something changed with the antenna. I changed the dongle to a brand new one, same issue.