Hello, I need some help I Installed op25 on Raspberry pi 4 i'm having problems with the data displaying in web browser it shows the active talkgroup id in the left column but does not remember it in the right one. tried it locally on the pi 4 browser with same effect It was working on my pi 3 with no problems any ideas?
here is my command line
./rx.py --nocrypt --args "rtl" --gains 'lna:30' -S 960000 -q 0 -d 0 -v 1 -2 -V -U -l http:192.168.1.17:8080 -T trunk.tsv 2> stderr.2
I'm not sure I entirely understand what you're describing, but that aside I would note that I've been tweaking the web console and curses terminal functionality a lot recently so you will want to make sure you've pulled the latest updates.
Here's how it is *supposed* to work now, which is different than it did a few weeks ago.
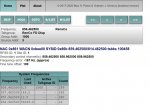
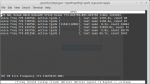
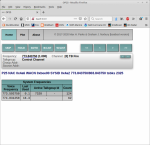
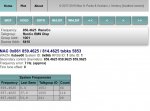
Top block displays details about any call actively being received and decoded.
System Frequencies block lists known voice channel frequencies, all tgids currently active, time since last known activity, and activity count. A given frequency may have none, one or two simultaneous active calls so there are two columns defined. The one on the right is timeslot 0 and the one of the left is timeslot 1. In the case of a totally idle frequency (or FDMA Phase 1 traffic) the two boxes will be combined into a single box showing either "-" or the active numeric tgid.
The purpose of these changes is so that the user now can see at-a-glance complete channel status across an entire site rather than simply the historic last activity which occurred on that channel. Attached screen shots show the curses terminal which has been running a while, and a web console which had been recently restarted. It takes a time for the frequencies to populate since they only get added when used for traffic.