OP25 Voice Dropout

Status
Not open for further replies.

cBell104

Newbie
Joined
Jun 6, 2010
Messages
7
Location
Brewster, OH
Running OP25 on a Pi3 using a NooElec NESDR Nano 3 (TXCO) listening to Ohio MARCS with the following command line
Code:
./rx.py --nocrypt --args 'rtl' --gains 'lna:49' -f 774.88125 -S 960000 -T all.tsv -V -w -D fsk4 -l http:0.0.0.0:8080 -M meta.json 2>stderr.2

My all.tsv file is
Code:
Sysname Control Channel List    Offset  NAC     Modulation      TGID Tags File  Whitelist       Blacklist       Center Frequency
Stark Co.       "774.63125,774.88125"   0       0x340   C4FM    marcs_tags.tsv  marcs_white.tsv

One minute I can get clear audio out of it and the next, on the same talk group, same conversation, it is either garbled or nonexistent.
All my graphs seem to look like they are supposed to when the audio is clear, but then if you sit and watch them, they all go out of alignment.

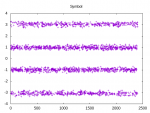
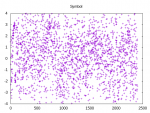
For example, my symbol plot, the first one being when voice is clear, the next being when the voice is garbled or gone. Any thoughts? Interference? Bad RTL dongle? Something else?
plot-symbol-160.pngplot-symbol-148.png
 

squirrel

Member
Premium Subscriber
Joined
Jan 4, 2006
Messages
110
Try dropping your LNA value. I was getting a lot of dropped voice until I got it down to around 43 with 40 being my magic number. Not sure if that is the cause but my experience.
 

cBell104

Newbie
Joined
Jun 6, 2010
Messages
7
Location
Brewster, OH
I think you are on to something. I went down to 37 and things seem to be clearing up, going to try to go lower and see what happens. Thank you for the suggestion!
 

boatbod

Member
Joined
Mar 3, 2007
Messages
3,338
Location
Talbot Co, MD
When the symbols get scrambled you'll definitely stop decoding voice. The question is why...
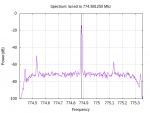
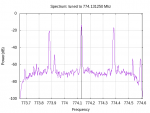
- what does you signal strength look like on the fftp plot (#1)
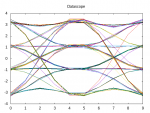
- what does the datascope plot (#3) look like?

I see from RRDB that MARCS is a Phase 1 system. Although that doesn't guaranteed it to be C4FM (fsk4) modulation, it certainly is possible. That said, have you tried cqpsk? i.e. temporarily remove the '-D fsk4' from the command line. One of the characteristics of c4fm vs cqpsk is that the fsk4 demodulator will lock on to a cqpsk signal but is prone to dropping out.
 

cBell104

Newbie
Joined
Jun 6, 2010
Messages
7
Location
Brewster, OH
FFT varies from looking like
plot-fft-48.png
to this
plot-fft-27.png
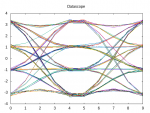
Datascope mostly looks nice and tight like
plot-eye-4.png
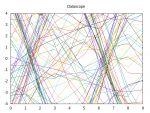
but occasionally shifts up the y-axis about .5 then back down, but sometimes briefly looks like
plot-eye-13.png

Will try changing the modulation and see what happens.
 

KA1RBI

Member
Joined
Aug 15, 2008
Messages
799
Location
Portage Escarpment
I see from RRDB that MARCS is a Phase 1 system. Although that doesn't guaranteed it to be C4FM (fsk4) modulation

It varies by county. Some MARCS sites are C4FM (example, Portage) whereas others are simulcast/LSM/"CQPSK" (e.g., Lake, Geauga).

FWIW, the datascope plot posted in post #5 of this thread is clearly "CQPSK", not C4FM...

Max
 

boatbod

Member
Joined
Mar 3, 2007
Messages
3,338
Location
Talbot Co, MD
It varies by county. Some MARCS sites are C4FM (example, Portage) whereas others are simulcast/LSM/"CQPSK" (e.g., Lake, Geauga).

FWIW, the datascope plot posted in post #5 of this thread is clearly "CQPSK", not C4FM...

Max

Thanks Max. I'm sure changing the demod will fix it right up.
 

cBell104

Newbie
Joined
Jun 6, 2010
Messages
7
Location
Brewster, OH
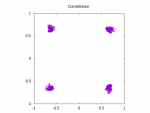
I removed the '-D fsk4' from the command line and the results seem about the same. I now see in the web interface Frequency Error: -47 Hz. at idle and this can go up to -600 Hz whenever there is a voice update (549559019.026926 voice update: tg(45160), freq(774381250), slot(-), prio(3) in the log) Constellation plot (now that it is available) looks like
plot-constellation-4.png

I read somewhere that the modulation in the trunk.tsv file isn't used, mine is still C4FM. Should I change it there too?

It seems like I can correlate the symbol plots and other plots messing up whenever there is a voice update. Possibly the end of the voice update?

New data plot now that I've switched to CQPSK
plot-eye-0.png
 

boatbod

Member
Joined
Mar 3, 2007
Messages
3,338
Location
Talbot Co, MD
I removed the '-D fsk4' from the command line and the results seem about the same. I now see in the web interface Frequency Error: -47 Hz. at idle and this can go up to -600 Hz whenever there is a voice update (549559019.026926 voice update: tg(45160), freq(774381250), slot(-), prio(3) in the log) Constellation plot (now that it is available) looks like
View attachment 68387

I read somewhere that the modulation in the trunk.tsv file isn't used, mine is still C4FM. Should I change it there too?

It seems like I can correlate the symbol plots and other plots messing up whenever there is a voice update. Possibly the end of the voice update?

New data plot now that I've switched to CQPSK
View attachment 68388
The modulation parameter in trunk.tsv is only used in very limited circumstances that are not part of a typical setup. You can safely ignore it.

Plots will be disturbed briefly at the instant of a voice update because the RTL dongle is tuning to the new voice frequency. This is normal and shouldn't affect operation.
 

cBell104

Newbie
Joined
Jun 6, 2010
Messages
7
Location
Brewster, OH
The modulation parameter in trunk.tsv is only used in very limited circumstances that are not part of a typical setup. You can safely ignore it.

Plots will be disturbed briefly at the instant of a voice update because the RTL dongle is tuning to the new voice frequency. This is normal and shouldn't affect operation.

Perhaps I'm chasing two different problems. I was associating the dropout with the plots glitching. Maybe they were unrelated. The dropout is definitely better after messing with the gain, so I will continue to tweak. Thank you to everyone for your assistance!
 

foxtail

Member
Premium Subscriber
Joined
Dec 19, 2002
Messages
313
Location
Niagara Region Canada
I find I need to use gqrx to look at and fine tune the freq. Most of the time I need to adjust the gain/lna to get a good signal. From there I just apply it to the rx.py command line.
 

boatbod

Member
Joined
Mar 3, 2007
Messages
3,338
Location
Talbot Co, MD
I find I need to use gqrx to look at and fine tune the freq. Most of the time I need to adjust the gain/lna to get a good signal. From there I just apply it to the rx.py command line.

op25 has the capability to display multiple different real-time plots that allow you to dial in the tuning.

#1 "fft" - full range spectrum display for broad ppm adjustments and to look out for other nearby signals.
#2 "constellation" - useful for qpsk signals to see if you are getting good decode (4 tight clusters) or have a noisy signal (broad, ill-defined circles)
#3 "symbol" - shows the 4 symbol streams recovered from the C4FM or CQPSK demodulator
#4 "datascope" - eye diagram that can be used to differentiate between C4FM (fsk4) and CQPSK modulation.
#5 "mixer" - narrow range spectrum display for ppm & fine-tuning adjustments. Balance the center of the signal peak either side of the tuning line.
 
Status
Not open for further replies.
Top