What is the pipper network?
This networks, called “Pips” in my log book, is a bit of a mystery. It has been seen periodically since early 2012 but no one is really sure what it is or what it is for. In my opinion some kind of network test or an ionospheric test program are most likely.
The network typically sends a short pulse of CW, a “pip”, on multiple frequencies. The pip or dash duration used has been seen to be anything from about 0.063 seconds length to about 1.5 seconds length. The duration between pips is some multiple of the pip length, and durations from 3 to 10.5 seconds have been noted. Typical combinations are 0.0625 (pip length, in seconds) x 3.0 (interval, in seconds), 0.125 x 6.0, 0.7 x 7.0, and 1.5 x 10.5. 0.125 x 6.0 is possibly the most reported.
As I said, the interval is some multiple of the pip length, so that I the 0.125 x 6.0 example the interval is 48 times the duration. This becomes important.
I said it appears on multiple frequencies, and you see from Bruce’s list it was when he reported it. How it hits these freqs is sequential. Typically hitting the lowest frequency first with a pip, then stepping up to the next highest and transmitting a pip there, next highest another pip, etc, to the top frequency, then back to lowest to start over. It sequences through the frequencies from low to high. In the example of a 0.125 x 6.0 pulse it would be possible to hit 48 frequencies in the cycle.
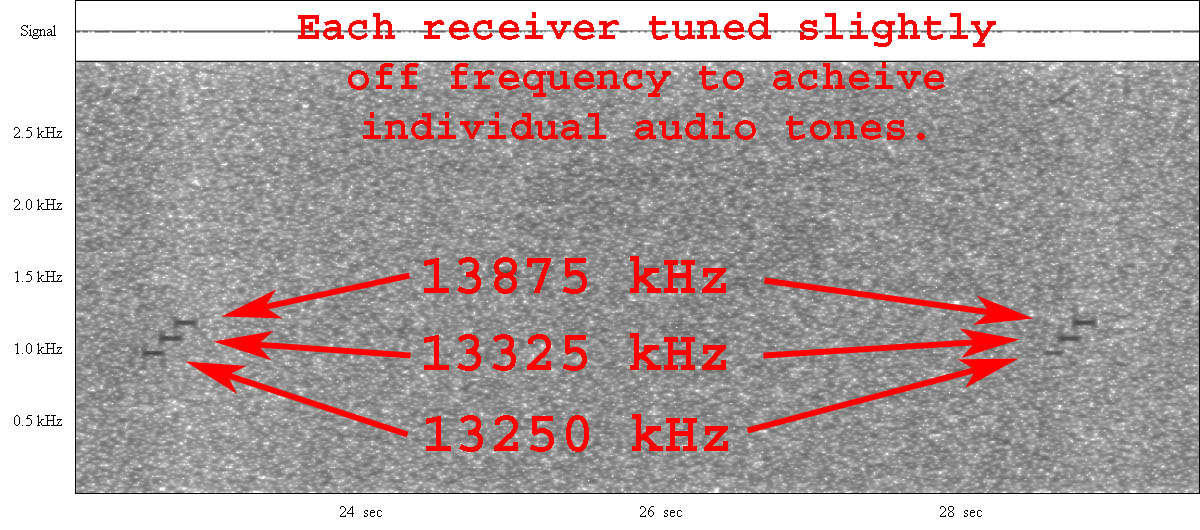
An example of this action can be seen in the following image. In this example three receivers are used to listen to three frequencies at the same time and plot them on the spectrogram. If each were offset form the pulse frequency by the same amount it would create one long pulse sound, so RX 1 is tuned 900 Hz low, RX 2 is 1000 Hz low, and RX 3 is 1100 Hz low, this makes three different pulse audio tones, of 900, 1000, and 1100 Hz, so that the three pulses can be seen visually on the spectrogram. The appearance of overlap in the image is caused by the AGC delay time used, there is no real overlap.
I said in the 0.125 x 6.0 example that up to 48 frequencies were possible, however more than 48 frequencies have been seen in use. This is because it is strongly suspected that at least two different locations (based on frequency occupation, DF cuts, and propagation) transmit these pips, and each location uses a different set of frequencies. So far I have seen no indications of more than two locations. Sometimes a frequency will be shared by the two sources, this results in synchronized, but out of cycle, double pulse on the frequency. Notice Bruce indicates one on 16725 kHz and 9225 kHz in his report.
Working backwards from these double pulse frequencies (compare next highest and lowest freq for sequential pulses) you can determine which frequencies belong to which source, and also find “holes” in your coverage, indicating possible unnoticed frequencies in the sequence.
T!

")