Uniden and Whistler Scanner selectivity shootout ..

Status
Not open for further replies.

SCPD

QRT
Joined
Feb 24, 2001
Messages
0
Location
Virginia
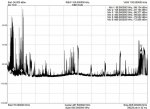
Just thought I would post a screen shot of the spectrum here ... from 70-905 MHz. This is only a short period of time but I am going to let it run for a few days to see how it looks.

As you can see on the left .. the FM band is quite aggressive. (between numbers 1 and 2)

There is little doubt that is a major cause of problems for our scanners.

The 800 MHz band on the right .. is also very active here. (the area of 5 and 6)

This plot is from a SignalHound USB-SA44B Option 1 as below with Spike software.

https://signalhound.com/products/usb-sa44b-option-1/
 

Attachments

  • 70-905.jpg
    70-905.jpg
    64.3 KB · Views: 461
Last edited:

Blackswan73

Active Member
Joined
Jan 29, 2015
Messages
1,402
Location
Central Indiana
Thank you edmscan for your informative thread. It was as a direct result of this thread I decided to try a HP2. So far I like it, but it takes getting used to. I still like my 668, but I think me and the HP2 are going to have a beautiful relationship.
 

Voyager

Member
Joined
Nov 12, 2002
Messages
12,060
Of course, a factor that isn't shown is the duration of the signals. FM is given to be continuously present, while some of the other signals such as in the Aircraft band may be strong, but only last a fraction of a second. Obviously, the latter won't impact reception as much as a continuous signal which will always impact reception.

Just curious - what did you use to capture the spectrum?
 

SCPD

QRT
Joined
Feb 24, 2001
Messages
0
Location
Virginia
Of course, a factor that isn't shown is the duration of the signals. FM is given to be continuously present, while some of the other signals such as in the Aircraft band may be strong, but only last a fraction of a second. Obviously, the latter won't impact reception as much as a continuous signal which will always impact reception.

Just curious - what did you use to capture the spectrum?

That plot is from a Signal Hound USB-SA44B. It is not the unit that was used at all for this thread. It is just what I used for the plot above. I do not know of the model of the equipment we used .. as it is not my test equipment.

Here are YouTube videos of this unit. These were done by my friend Ray who actually did the testing above. I was there as assistant. :wink:

Part 1 https://www.youtube.com/watch?v=9z_avpvUd5A
Part 2 https://www.youtube.com/watch?v=WST6GOaar44
 
Last edited:
Status
Not open for further replies.
Top