spectrum analyzer "hold peak" function?

Status
Not open for further replies.

Audiodave1

Member
Database Admin
Joined
Dec 27, 2001
Messages
1,860
Location
Chadds Ford, PA
Hello,
I am new to SDR, I picked up a RTL2832u and have been enjoying it.

I am looking for a software package that will either log peaks on the spectrum display or store the peaks on the display while I hover over them to figure out the frequency many hours or days later.

Frequency hunting in the fed bands.

Does such a piece exist or is it hiding in plain sight in SDR#?

Dave
 

dlwtrunked

Member
Premium Subscriber
Joined
Dec 19, 2002
Messages
2,125
Hello,
I am new to SDR, I picked up a RTL2832u and have been enjoying it.

I am looking for a software package that will either log peaks on the spectrum display or store the peaks on the display while I hover over them to figure out the frequency many hours or days later.

Frequency hunting in the fed bands.

Does such a piece exist or is it hiding in plain sight in SDR#?

Dave

Been there...
RTLSDR Scanner | Ear to Ear Oak
 

br0adband

Member
Joined
Apr 8, 2005
Messages
1,567
Location
Springfield MO
There was a plugin in the past that would just scan a given input range (lowest to highest frequency) and then store frequencies that caused it to stop because of some transmission, along with the ability to set a given squelch level so you'd be able to get above some stuff that might be birdies in the hardware and also a timer on transmissions so it would continue after whatever duration you set (and not just get stuck doing nothing from that point on).

I can't say much else about it other than a) I knew it did exist at one point because I used it once or twice but wasn't satisfied with the actual results and b) I have no idea what it was named or where I found it because it was almost 2 years ago when I did, back when I was first getting involved with the SDR way of doing things with my first RTL stick.

I'm not sure if the Frequency Manager Suite for SDR# can do that, it might, but I don't use the suite myself these days so, that's at least something you can look into.

Now as for "holding peaks" so you can go back and look at them later, the only way to do that would be to literally capture the raw signal (which can end up being gigabytes upon gigabytes of drive space depending on how wide your bandwidth window happens to be) and then play it back later on then watch for the peaks yourself. Realize that the raw capture data is literally everything happening inside the bandwidth window at the same time so it's literally going to be a huge file if you intend to do that for hours. The hunt and capture method of just saving the frequencies as I mentioned above is vastly more efficient and doesn't require real time "playback" to see what's going on.
 

Audiodave1

Member
Database Admin
Joined
Dec 27, 2001
Messages
1,860
Location
Chadds Ford, PA
Thank you for the input,
I will try the ear to ear...

I do not have any desire to go back and watch the display...and gigs of data.

Regards,
Dave
 

slicerwizard

Member
Joined
Sep 19, 2002
Messages
7,643
Location
Toronto, Ontario
The first thing that came to mind was rtl_power. It's designed to watch an arbitrarily sized chunk of spectrum. For smaller chunks, FMP and FMP24 would also be an option as they too have a peak hold display, which is what you're looking for. SDR# has an option to mark peaks, but it doesn't hold them, so it's out unless there's a plugin that does it.

Googling turned up a GUI wrapper for rtl_power called rtl panorama. I tried it out, but it has some issues. I ran it side by side with FMP24.

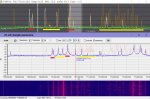
FMP24 was watching a 2.4 MHz chunk of the 770 MHz spectrum while panorama/rtl_power were watching 768 to 774 MHz. The latter has some serious FFT windowing issues as strong carriers would wipe out neighbouring signals. I marked up the attached screenshot to highlight the problem.

The first red line shows where three carriers are present, but you can't really tell in the lower display.

The second red line shows where three carriers are present and a fourth was seen prior. Again, in the lower image, you really can't tell much.

The first yellow line shows where seven carriers were seen, but the panorama window shows only four.

The second yellow line covers 20 carriers, but I make out only 13 in the panorama display.

Again, this appears to be due to a lack of proper FFT windowing. There is enough room in the panorama display to show all the carriers, but it doesn't.

Also, with FMP24, I can see the exact carrier frequencies when I mouse over each carrier (like the 770.85625 MHz shown), but panorama shows a messy value (770.854788877 MHz)


I could see using rtl panorama to watch a large chunk of spectrum, but only if it was a pretty dead band, otherwise signals are going to wipe each other out. If an area had activity, I'd switch to FMP24 for the fine grained display.
 

Attachments

  • Peak Hold.jpg
    Peak Hold.jpg
    68.9 KB · Views: 579

Audiodave1

Member
Database Admin
Joined
Dec 27, 2001
Messages
1,860
Location
Chadds Ford, PA
Thank you so much for the detailed information!

Much appreciated.
Dave


The first thing that came to mind was rtl_power. It's designed to watch an arbitrarily sized chunk of spectrum. For smaller chunks, FMP and FMP24 would also be an option as they too have a peak hold display, which is what you're looking for. SDR# has an option to mark peaks, but it doesn't hold them, so it's out unless there's a plugin that does it.
 

dlwtrunked

Member
Premium Subscriber
Joined
Dec 19, 2002
Messages
2,125
Thank you so much for the detailed information!

Much appreciated.
Dave

As mentioned before, I use RTLSDR Scanner from RTLSDR Scanner | Ear to Ear Oak .
I used to use the Panorama program but found rtlsdr-scanner had more features--not only can it do peaks, it can do averages so that one can produce nice images.

Another nice feature is that it if a GPS is hooked to the PC, rtlsdr-scanner can make use of that.

One thing I do is run rtlsdr-scanner with GPS coordinates also displayed on the screen (sometimes using another program like free VisualGPS). Then I run a auto-screen capture program like free "autoscreen capture" and capture the screen every 20 seconds so that I do not miss anything on the waterfall. Afterwards (when I get home), I use free Windows Moviemaker to make a video that I can easily review to see that was seen. I stop the video to see where I was at the time according to the GPS coordinates.

rtsdr-scanner can also make a "heat map".
 
Last edited:

slicerwizard

Member
Joined
Sep 19, 2002
Messages
7,643
Location
Toronto, Ontario
As mentioned before, I use RTLSDR Scanner from RTLSDR Scanner | Ear to Ear Oak .
I'm trying it out right now. It's definitely better than panorama, but it's doing some weird things - during continuous scanning, the plot goes blank for long periods and the UI gets unresponsive. It's also sucking up a gig of RAM and a lot of CPU time. Now it seems to have locked up. Well, not quite - it claims to be completing scans, but no plot shows up. RAM usage drops, then starts climbing again. Looks like it's continuously asking the system for small chunks of memory instead of just grabbing what it needs in one shot. Scans are taking forever. Now up to 1.7 gigs used. A 400 to 470 MHZ sweep running on an i5 processor with 8 gigs of RAM shouldn't fall over this badly. Seems like I have to tell it to not retain any previous scans. Now usage stays around 500 MB, but I keep getting the hourglass. This acts like a badly written single threaded app. Meanwhile, the Airspy Spectrum Spy software sweeps far more spectrum with no drama...
 

dlwtrunked

Member
Premium Subscriber
Joined
Dec 19, 2002
Messages
2,125
I'm trying it out right now. It's definitely better than panorama, but it's doing some weird things - during continuous scanning, the plot goes blank for long periods and the UI gets unresponsive. It's also sucking up a gig of RAM and a lot of CPU time. Now it seems to have locked up. Well, not quite - it claims to be completing scans, but no plot shows up. RAM usage drops, then starts climbing again. Looks like it's continuously asking the system for small chunks of memory instead of just grabbing what it needs in one shot. Scans are taking forever. Now up to 1.7 gigs used. A 400 to 470 MHZ sweep running on an i5 processor with 8 gigs of RAM shouldn't fall over this badly. Seems like I have to tell it to not retain any previous scans. Now usage stays around 500 MB, but I keep getting the hourglass. This acts like a badly written single threaded app. Meanwhile, the Airspy Spectrum Spy software sweeps far more spectrum with no drama...

Yes, it goes blank when it is collecting data. I have not had it ever lock up but it is a resource hog. I do not keep previous scans per my remark about running the autoscreen capture program. I have never had the hour glass show. I do not scan over 20 MHz at a time. I also use AirSpy spectrum Spy-I have suggested to Youseff some changes to it like peak and average but am not sure if he understood what I as after. I think he is still developing that software. (My version number in "About" shows "Updated: 04/13/16 07:21:40". I see there is a 09/20/16 release.)

I am using a Win 7 AMD Phenom II XC 1045T Processor at 2.70 GHz 64-bit most of the time but have not seen problems with a MS Surface Pro..
 
Last edited:

dlwtrunked

Member
Premium Subscriber
Joined
Dec 19, 2002
Messages
2,125
If it is having problem perhaps trying the non-stand alone might help, assuming you installed the stand-alone--or visa versa (I used to use that with no problem). Note that goes out on the net to install other things (python, matplotlib, numby, etc.) and I *think* the last time I tried installing that version it may have failed to find something it needed--perhaps due to a net problem.
 
Status
Not open for further replies.
Top